
Cost rate beyond spreads: a hidden indicator that determines the long-term survival of an account
- 2026-10-22
- Posted by: Wmax
- Category: Tutorial

An account has "not lost much" for several consecutive months, but the balance is quietly getting smaller. The problem often lies in the cost rate. Cost rate is the ratio of transaction costs to transaction amount within a certain period. It is not as obvious as a single spread, but it is a hidden variable that determines the long-term growth of the account. This article talks about how cost rate affects the life and death line of an account.
What is the cost rate
The calculation of the cost rate is simple: divide the total cost (total of spreads, fees, overnights, and slippage) over a period of time by the total transaction amount during the same period. For example, if the total cost in a month accounts for several thousandths of the transaction amount, this is your cost rate. It converts "each small cost" into "account-level consumption ratio", which can better reflect the true cost pressure than a single spread. For high-frequency traders, the cost rate is often higher than that of ordinary traders, which is a manifestation of frequency amplifying the cost weight.
The mathematics of cost rate determining growth
Account growth depends on "net return", and net return is equal to gross return minus cost rate. If the gross return rate of a strategy is not high and the cost rate increases, the account will spin around or even shrink. What's more critical is the direction of compound interest: the cost rate is a continuous deduction, which erodes the principal in each period. The longer the time, the greater the compound interest gap. Two accounts with the same initial cost rate are slightly different, and the difference will be very obvious after a few years. This is why professional traders regard cost ratio as one of the core indicators of account physical examination, instead of just looking at the profit and loss curve.
No matter how high the winning rate is, the cost line must be exceeded
Some traders have a good winning rate, making seven out of ten trades, but still make no money. The reason is often: the average profit of profit orders is only a little higher than the cost, while the losses of loss orders are not controlled. After factoring in the cost rate, you will find that "profit-making transactions" and "cost-covering transactions" are two different things. The winning rate itself does not constitute an advantage, but the expected value after deducting costs does.
How to calculate your own cost rate
The first step is to pull out all the transaction records in the last one or two months; the second step is to add the spread, handling fee, overnight, and slippage into the total cost; the third step is to divide it by the total transaction amount in the same period to get the cost rate. Then use it to compare with your average profit and loss: if the cost rate is close to or even exceeds the average single profit ratio, it means that the cost is eating up your main source of profit.
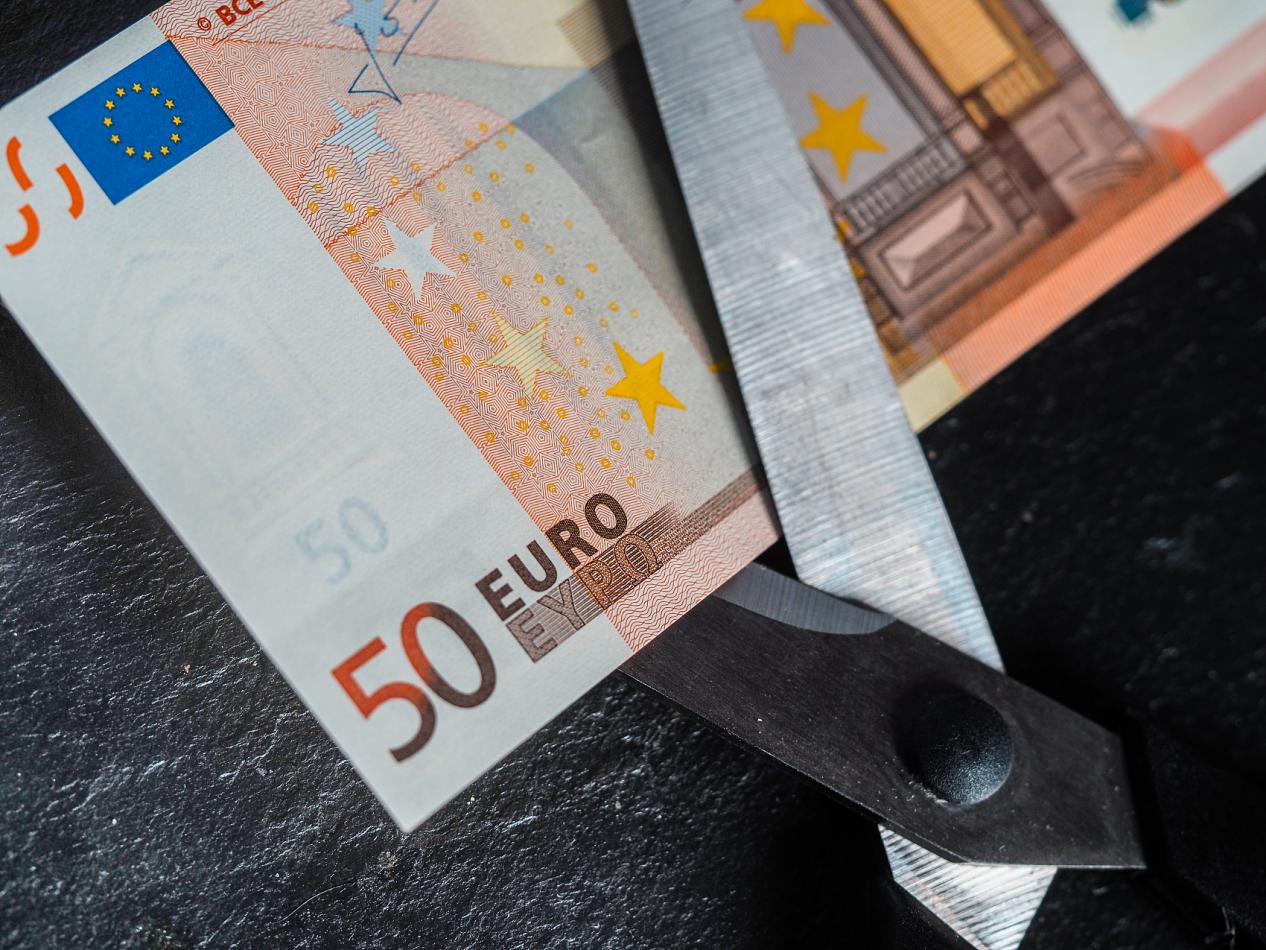
Four Directions to Reduce Cost Rates
The first is to control the frequency and reduce unnecessary entries and exits. The fewer transactions, the lower the cost rate; the second is to choose a period with good liquidity and use the same judgment to pay less spreads and slippages; the third is to standardize the order type, so that if you can limit the price, you will not blindly market the price; the fourth is to appropriately pool funds to reduce the frictional cost of cross-account transfers. There is no need to do all four directions at once, start with the most obvious one or two.
Take WMAX as an example: Making cost rates visible
Putting cost rate management on the platform, WMAX provides transaction reports and historical order details. The total cost can be calculated by cycle, which is convenient for traders to calculate their own cost rate. Account fee rules are publicly available and can be checked, and spreads, overnights, and deposit and withdrawal fees are all well-documented. Simulation accounts are suitable for measuring cost rate changes under different transaction frequencies in a stress-free environment. It should be noted that the platform provides a data basis, and the interpretation and control of cost rates still depend on the traders' own discipline. Whether WMAX is right for you depends on whether you're willing to pull out the cost rates regularly and take a look.
write at the end
"Not losing much" does not mean "growing". The cost rate is the hidden indicator of the long-term survival of the account. Calculate it clearly, compare it with the win rate profit and loss ratio, and continue to optimize in the four directions of cost reduction, then the account's growth line will truly be upward. Regardless of whether you choose WMAX or another platform, it is recommended to incorporate the cost rate into regular physical examinations and always control the risk within an acceptable range. Leveraged trading carries high risks. Please fully understand the relevant rules before entering the market and make prudent decisions.

 English
 Chinese
 Vietnamese
 Hindi
 Japanese
 Thai
 Korean